Adivasi Survey Dashboard — Nandurbar
Bilingual dashboard of a 281-household survey of the Pawra community
- Category
- Data Story
- Status
- Live
- Role
- Solo build
- Organisation
- YUNG Foundation
- Date
- 2026-05-31
- Built with
- HTML, JavaScript, Chart.js, GitHub Pages
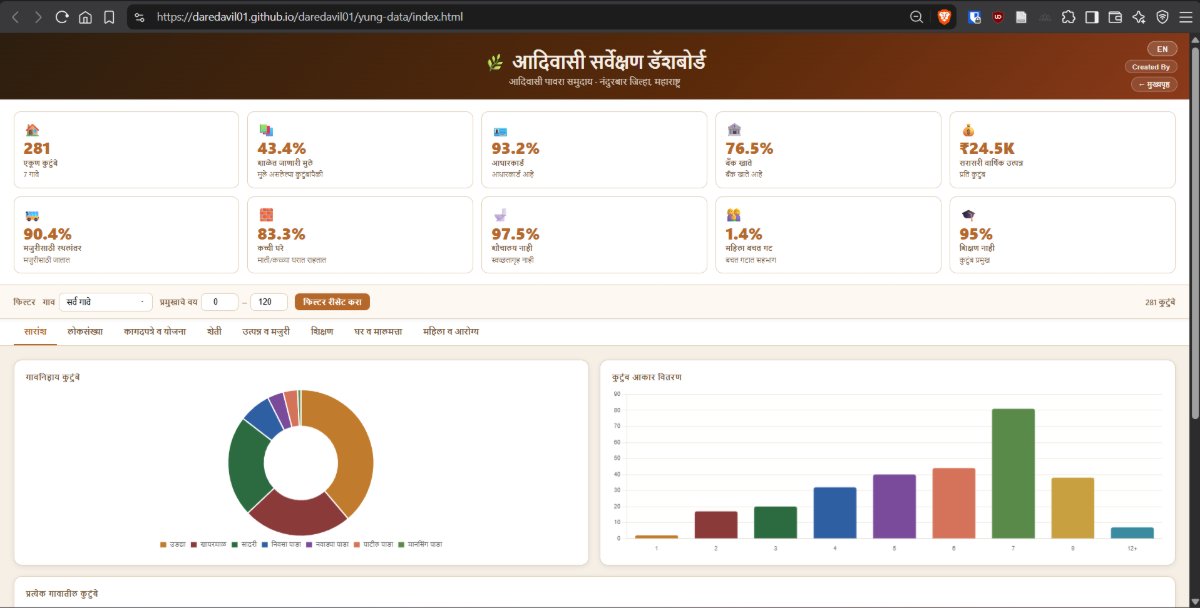
An interactive dashboard for a primary household survey of the Adivasi Pawra community in Nandurbar District, Maharashtra. It turns 281 household records from 7 villages into 28 charts across 8 themes — demographics, documents and government schemes, agriculture, income and labour migration, education, housing, and women's health — in Marathi or English.
Problem: The survey existed as a Marathi spreadsheet with multi-line headers and Devanagari numerals. Field workers and the foundation could not see, at a glance, which villages lacked Aadhaar, bank accounts, toilets or school attendance.
Solution: A no-build static dashboard that parses the raw CSV in the browser, strips personal data, and charts every dimension with village and age filters and a bilingual interface.
Outcome: Live on GitHub Pages as a working tool for YUNG Foundation to plan scheme enrolment, education and health work by village.
- 281 households across 7 villages, 51 survey columns per record
- 10 headline KPIs and 28 charts over 8 thematic tabs
- Marathi / English toggle for every label, chart title and filter
- Village and household-head age filters recompute every chart
- Custom CSV parser handles multi-line quoted fields and Devanagari numerals; names and phone numbers are excluded
Tags: #ngo, #data, #data visualization