After the Feed
A 15-minute interactive story about the months after leaving social media
- Category
- Data Story
- Status
- Live
- Role
- Solo build: design, writing and frontend
- Date
- 2026-10-19
- Built with
- Astro, TypeScript, CSS custom properties, Zod, Playwright, axe-core, Lighthouse, Cloudflare Pages, Node.js
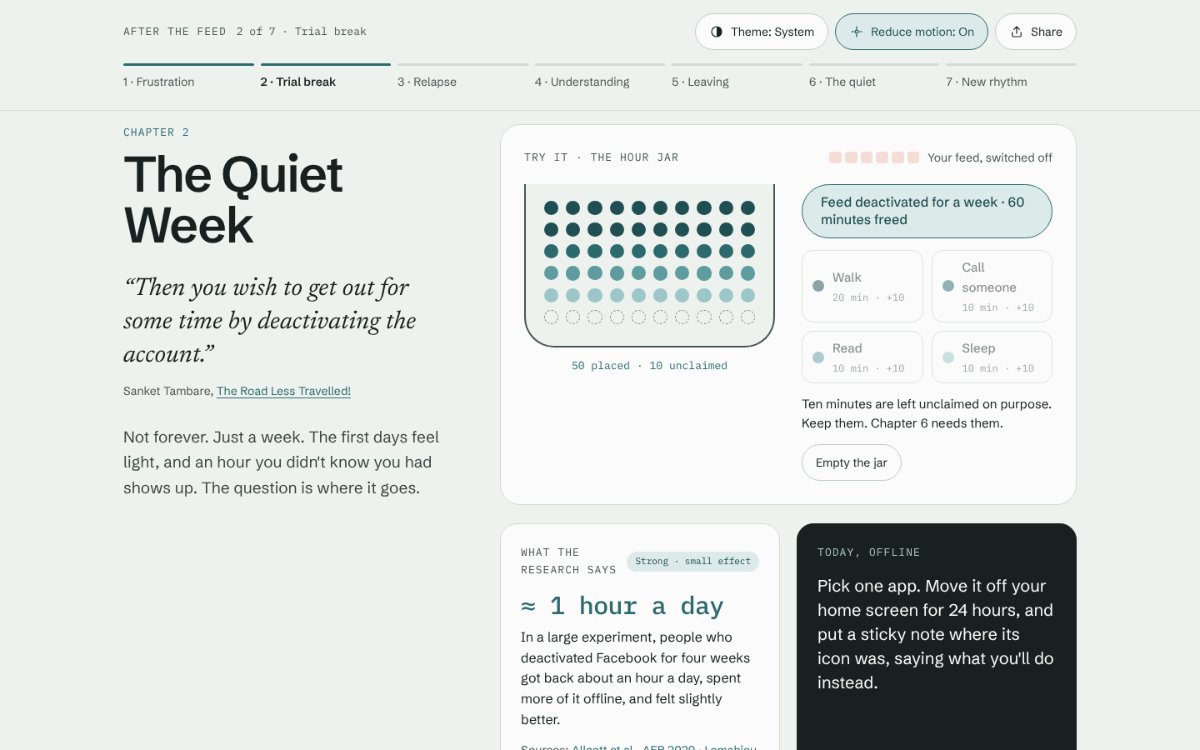
After the Feed is a 15-minute interactive story about what actually happens in the months after you leave social media. It is told in my own words from my posts, and each chapter pairs that with honest research. Seven chapters each have one small, hands-on mechanic: a highlight wall, an hour jar, a feed that pulls you back, a why ledger, a parody of the account-deletion maze, a quiet desert and a first habit. It invites rather than pushes. Small average effects are called small, every finding has its caveat one tap away, and nothing you type ever leaves your device.
Problem: Most writing about quitting social media either overpromises ("delete it and your anxiety disappears") or shames people for staying. The research is more modest: on average the effects of a break are small, but some people gain a lot. Meanwhile, leaving a platform is made hard on purpose, through confirm-shaming, hidden deactivation options and endless "are you sure?" steps. I wanted to tell the honest version of my own experience without becoming another persuasive, data-hungry product.
Solution: I built a calm, scroll-driven story where each chapter's mechanic lets you feel one idea instead of being told it: watching a highlight scroll past in seven seconds filling an hour jar with what a free hour could become trying to close a feed that pulls you back walking through a parody deletion flow sitting with the boredom of a "desert" All the copy lives in data files, and a build check keeps text out of the code. Mechanics are vanilla TypeScript on a static Astro site with a strict Content Security Policy, bundled fonts and no third-party calls. Accessibility, both themes and reduced motion were built in from the first commit and are tested on every build.
Outcome: The story is live on Cloudflare Pages at a custom domain. It loads in under 200 KB, scores 100 in all four Lighthouse categories on mobile, and passes 320 automated accessibility and behaviour tests in both themes and at phone and desktop widths. Readers finish with their own reflection, a first habit in their calendar and a route to human support. Nothing is tracked, and they can erase their answers with one button. Its closing line sums it up: "Average effects are small. Some people gain a lot. You're allowed to find out which one you are."
- 7 chapters, each with one interactive mechanic, in my own words and backed by linked studies
- Every finding has its caveat one tap away and a link to the study; 12 quotes checked against their posts
- Mirrorloop: a fictional, skippable parody that names dark patterns by their research names
- Private by design: no analytics, cookies, accounts or third-party requests; answers stay in one local storage key
- WCAG 2.2 AA: zero axe violations, full keyboard and screen-reader paths, reduced motion honoured
- Lighthouse mobile 100/100/100/100, LCP 1.5 s, CLS 0, 183 KB first load
- Light and dark themes, with contrast checked at every frame of the colour-drain animation
- Adds your chosen habit to your calendar as a .ics file generated on the device
- 320 automated Playwright + axe tests against the production build, at phone and desktop widths
Tags: #digital-wellbeing, #interactive-storytelling, #accessibility, #privacy, #scrollytelling, #research-communication